What happens with online shopping when it rains? Linking online shopping to weather and exploring drivers of noise in sales data
 Countless factors affect online shopping, many of which aren’t well known, classified, or understood. Much like the climate system, online sales vary across different time periods–year, month, week, day, hour–with smaller levels of variability often dismissed as so much ‘noise’. Ipads might be trending one day, and blenders the next, but over a month long period, maybe it’s towels that are the top seller. Yet what if we could really examine this ‘noise’? Isolate it? Explain it?
In the dark ages before I came to Rich Relevance, I studied climate change–no joke–and while I gained many insights from my research (global warming = not a hoax), the greatest was a general appreciation for how the environment feeds back onto itself, and how humanity is intrinsically linked to that environment. Thus I set forth with eagerness in this blog post to revisit my old friend ‘weather’ and determine if our environment affects online shopping.
My original hypothesis was simple: Weather affects how and when people shop. To extrapolate that even further, I’ll surmise that people habituated to rain, like Seattle natives, will abandon the digital world when it’s sunny and enjoy the great outdoors.
I began my exploration by pulling sales data for four major retailers from differing verticals (Home/Furniture, Wholesale, Clothing, and Big Box), concentrating specifically on the greater Seattle area. For weather I used daily temperature and precipitation data from the Seattle Tacoma Airport, and long-term temperature normals from the National Climatic Data Center to identify unusually hot, cold, and rainy days. I isolated noise from the long term sales trend by subtracting daily sales data from a moving average, and cropped the dataset to only look at Saturdays and Sundays-—days where I’d expect people’s behavior to be the most influenced by weather since they’re not subject to the work week.
The resulting finding was a negative relationship between temperature and sales for our Home/Furniture and Wholesale retailers: hot days seemed to result in significantly fewer orders, and cold or rainy days resulted in more orders. This trend was present but less pronounced (and outside a 95% confidence interval) for the Clothing and Big Box retailers. In summary, Seattleites prefer to shop online when it’s rainy, and either shop less or shop in-store when it’s hot out.
However, there are some fundamental flaws with using temperature as our weather metric. Most notably, hot and cold days tend to cluster, such that our scant 25 or so unusually hot days may not be representative of all hot days year round. In Seattle, for example, our hot days clustered mostly around an unusually hot fall in 2011.
My inner scientist unsatisfied, I decided to look at something we see every day: clouds. Solar radiation can be used to approximate sunlight received at the earth’s surface, so I used measurements of solar radiation (from Washington State University’s AgWeatherNet) and the BIRD clear sky model (available from the National Renewable Energy Laboratory) to create a clear sky index of our period of record. This index represents what fraction of the sky is clear (versus cloud covered).
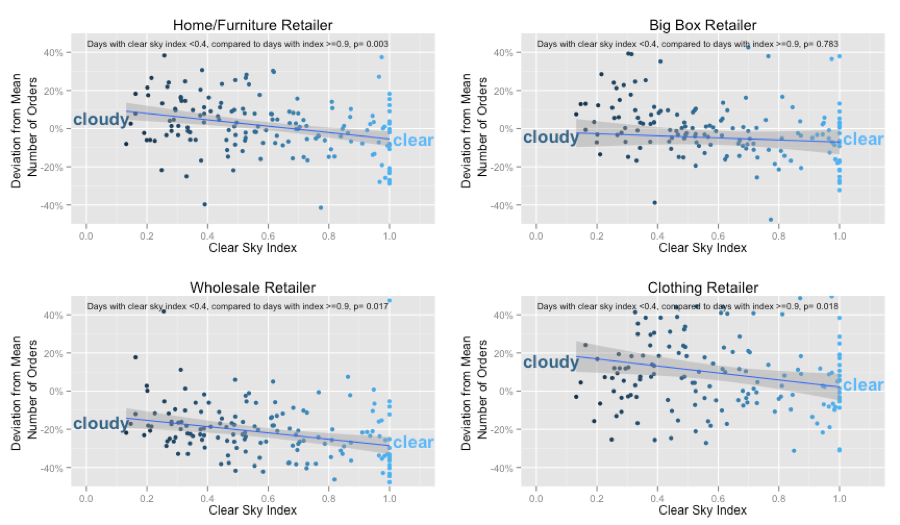
When we repeat the prior analysis using a clear sky index, we find similar, and more convincing results (see the graphs below).

The difference between a clear day and a cloudy day means a difference of 10-12% in orders for our Clothing, Home/Furniture, and Wholesale retailers, and, just as interesting, makes no significant difference for our Big Box retailer. In general, people of Seattle buy less online on sunny weekends, and in particular they buy less home/furniture, wholesale, and clothing goods. But is this a bad thing for the retailer? Possibly not. Many users may be shopping at the actual physical stores on these sunny days, thereby not detracting from total sales. Who wouldn’t rather try on a dress on-site when it’s a nice day out? This could explain some of the variation between retailers as well–verticals that sell goods with subjective attributes (where size, shape, texture, smell, etc. are important considerations for purchase) see more online traffic when people can’t get to the physical store due to bad weather, because the underlying preference for most people is to see those goods on-site. By the same token, do we really need to see our DVD and box of mac and cheese to order it from the Big Box retailer?
In-store shopping history may one day give us the full picture, but until then I’ll rest with a simple conclusion. My hypothesis was correct: weather influences sales to a small degree, particularly at retailers of certain verticals, but it’s by a small enough margin that there’s room for debate. Much as I’d like to blame everything on the weather, the true insight from this data exploration is not any specific attribution of cause and effect, but rather the basic, underlying notion that we can quantify and break down noise in sales data to specific drivers. Today we’ve linked our noise to the weather; what will we look at next week?


