Today, we released our new study of more than 1,000 U.S. consumers, highlighting shopping preferences and sentiment this holiday season. One common theme that emerged is that Americans continue to be all about “instant gratification”; even benefits like Amazon Prime can’t top the pleasure and convenience of a purchase in-hand at check out.
But when shoppers visit the store is starting to matter. REI’s bold move to #OptOutside on Black Friday—closing its doors and website and paying its 12,000 employees to go outside—reflects they primary sentiment we found in our survey: Two-thirds of respondents disliked retailers being open on Thanksgiving Day.
Whatever your thoughts are about the kick off to the holiday shopping season, the store remains the centerpiece for consumers. In fact, retailers that implement simple digital innovations to meet the increased volume and needs of shoppers this season will reap big rewards, sealing the fate of the brick-and-mortar store as a key competitive advantage.
This holiday, the number one reason that Americans will head to the store is to get an item immediately. But long lines at checkout mar the experience. In fact, 73% of respondents cite this as their biggest frustration. What can stores do to deliver immediate satisfaction and convenience? Mobile check-out in store and click-and-collect were cited as welcome innovations.
Once in store, U.S. shoppers (thanks to smart phones), are increasingly self-sufficient—and impatient—when stores fail to deliver the same convenient, seamless experience they have online. Over half of Americans cited out-of-stock or unavailable items as a main frustration, while 1 in 5 are frustrated by sales associates who can’t help them find what they need, inconsistent pricing and items that don’t match what was researched online. The good news: consumers welcome a digital fix to these shopping woes. For 4 in 10 shoppers, self-service kiosks to check pricing, availability and product recommendations were cited as one of the most valuable store features this holiday.
As the lines between online and offline shopping continue to merge, the store remains more than a holiday tradition. New digital technologies and advances in in-store personalization can address nearly all of the frustrations shoppers experience in store. This is welcome news for traditional retailers as they strive to gain the operational, marketing, merchandising and “instant gratification” edge in their battle with Amazon this holiday and beyond.
I invite you to check out our full survey results here.

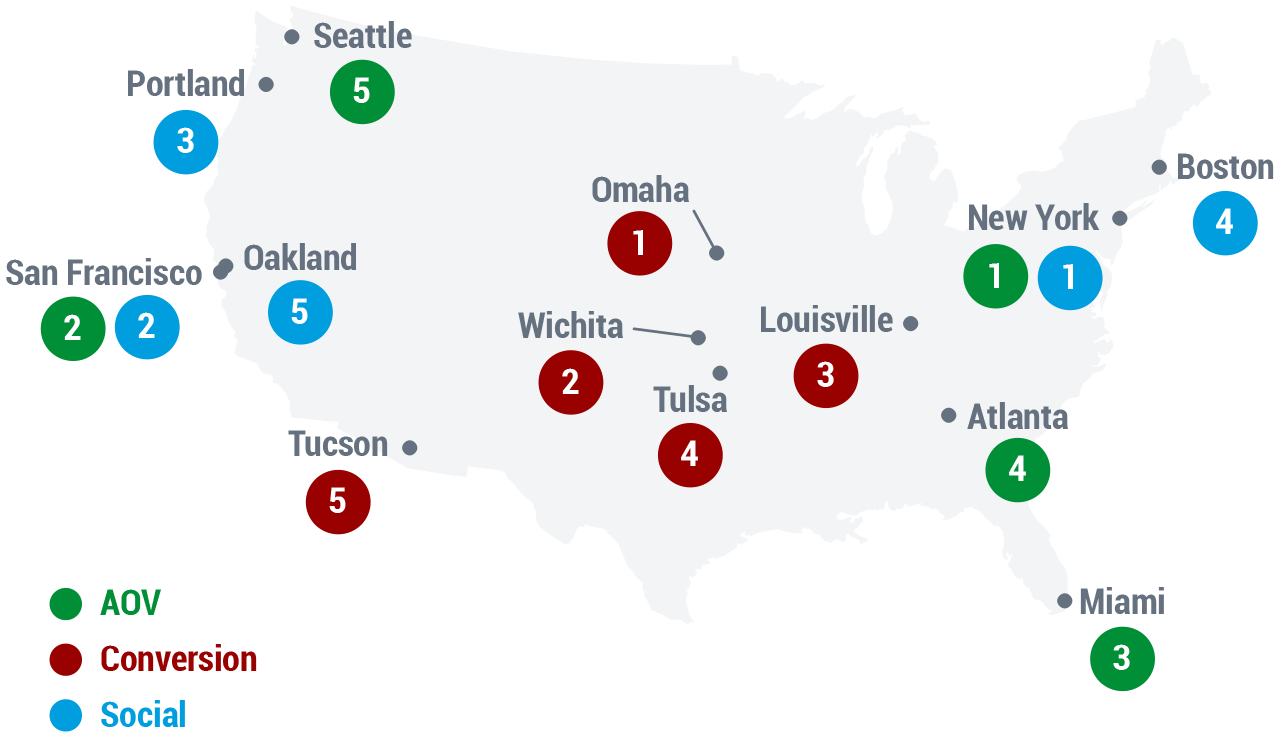
Continuing our series on “2013 Season of Shopping Insights,” we analyzed shopping behavior in the top 50 cities across the US (including mobile share of views, and mobile share of sales) and uncovered some regional shopping patterns—and anomalies—that may surprise you.
Which cities lead the way when it comes to conversion, AOV, and social activity? What are some key shopping trends in our great states of Texas and California?
Top 5s
| AOV | Conversion Rate | Social Referral Percentage |
|
|
|
Texas Trends (AKA Austin “Oddities”)
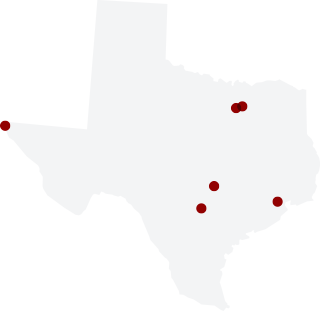
- Mobile Sales. Mobile accounted for over a quarter of sales in Dallas, and over 20% in Houston, but was merely average in El Paso and Fort Worth. Surprisingly, Austin lags in mobile.
- Shopping Behavior Similarities. Dallas, El Paso, Fort Worth, and San Antonio are all similar, but Austin—once again the odd one out—is closer in shopping behavior to Portland than its Texas sister cities.
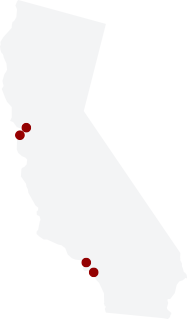 California: Coastal City Surprises
- Long Beach is closer in overall shopping behavior to Phoenix than to LA.
- San Francisco is more like Atlanta than like Oakland in its shopping behavior. (SF has higher AOV, but Oakland has the greater share of mobile traffic and sales.)
Methodology: This study uses data about the top 50 US cities (by population) from over 100 sites on Thanksgiving Day (2013-11-28). The data consists of over 5.5 million sessions and 200 thousand orders.
More from the 2013 Season of Shopping Insights series:
- Shoppers Less Responsive to Retailers’ Day-Specific Promotions though Cyber Monday Gains Ground
- Insights Across America
As a data-driven company that derives relevant shopping insights from the billions of shopping sessions we touch each year, we wanted to assemble a series of interesting take-aways that showcase notable trends of the all-important holiday shopping season.
Just as the holiday season is about feelings as much as shopping, per se, so too holiday data can be seen for the picture it paints about where we find ourselves as 2013 draws to a close. Anthropologists have always understood that shopping, giving, and exchanges of goods say much about a culture. While our specialities are computer science, engineering, and marketing, we invariably find what data can tell us very interesting … and we hope you will, too.
Please join us as we explore the trends we’re seeing during this December, starting with this first nugget:
Seasonal Shopping Insight #1
Shoppers Less Responsive to Retailers’ Day-Specific Promotions though Cyber Monday Gains Ground
 US consumers appear to be spreading out their online shopping visits and spending over the entire holiday period, rather than concentrating their activity on key days such as Black Friday and Cyber Monday—perhaps to the consternation of retailers who devote massive marketing effort to lure shoppers in-store and online on select days. (See a related story in Internet Retailer, which used our data to discuss mobile e-commerce trends over the start of the holiday season.)
We reviewed comparable sites, year-over-year, examining the share of revenue, orders, visits, and other key metrics over the 11-day period from Thanksgiving through Sunday, Dec 8 (using comparable days for 2012).
On the plus side:
- Conversion rates are higher this year, especially in the post-Cyber Monday period.
- Average Order Value (AOV)—the average amount a shopper spends—is higher compared to last year for the 5 key shopping days from Thanksgiving to Cyber Monday.
But the share of both shopping visits and orders is less on those five key days:
- In particular, Black Friday in 2013 had 13% of the 11-day orders, down from almost 16% in 2012.
- Each of the five days in 2013 has a smaller share, and each of the post Cyber Monday days has a larger share of visits, when compared to the prior year.
In short, it looks as if the shopping period is spreading out—and consumers are resisting the siren song of Black this or Cyber that. For retailers, this may presage a much more competitive period until the 25th.


More from the 2013 Season of Shopping Insights series:
- Shoppers Less Responsive to Retailers’ Day-Specific Promotions though Cyber Monday Gains Ground
- Insights Across America
‘Tis the season that many retailers look to tactics and strategies to programmatically maximize their e-commerce conversion, and customer value pre-peak. These new innovations are critical for success, but always include a bit of risk. Are there any “tried-and-true” approaches we can confidently implement pre-peak with 100% certainty?
![]()
We’re happy to advise you on how best to implement key tools such as those RichRelevance offers and believe that this—paired with “Hill Climbing” will benefit you most. Hill Climbing maximizes your profits by optimizing assets you already have. We encourage you to “Hill Climb” hard for the next few weeks to leverage your existing strengths, insights, and capabilities.
Model yourself after the most successful Hill Climbing organizations (Amazon, eBay, Google) and listen to data, test ideas rigorously, and optimize constantly. Two key tenets of Hill Climbing are Metrics and Meritocracy—make consistent measurement of change easy, and combine this with agile change management. Combining these two engenders a culture motivated by positive results and empowered to make them happen one step at a time.
 Thanks Giving.
I love today: The day before Thanksgiving.
Today we get the opportunity to think of everything for which to be thankful, and we have good reason to. In the retail world, we’ve just straight-up busted our tails the past months all in preparation for this Friday—ensuring everything is perfectly tuned, dialed and scaled to handle the consumer uproar which will be this weekend and the ensuing 15-20 days of craziness. Today is almost a combination of a final sprint with a huge breath out at the end of the day. “Whew—thank goodness for our amazing IT team. Let’s let ‘er roll!”
[ As an aside, top search terms for this season so far? —Tablets Rule! #1 may be TVs, but both #2 and #3 are for tablets: ipad, and tablet]
 I know the absolute last thing you want to be thinking about right now is the Christmas holiday, but this year RichRelevance is giving you your gift early. Today we released our “12 months of Christmas” white paper—chock full of best practices for retailers to help jump start their Holiday 2012 season planning.
 For every month, we offer insights and best practices on ways to maximize your efforts in a variety of fields, including:
- Cross-Channel Marketing
- Mobile
- Search
- Social Media
- Email Marketing
You’re invited to get ahead of the curve, and start utilizing all of the opportunities you have at your fingertips right now to make your next holiday shopping season your best ever!
Happy (early) Holidays!