Black Friday 2015: Still a bellwether for holiday shopping?
There was a lot of talk this year about Black Friday being “less black” and less of a bellwether for holiday shopping. In addition to REI’s #OptOut campaign, an increasing number of retailers held sales earlier, and have turned Cyber Monday into “Cyber Week” by stretching their sales out longer. So how did it all pan out behind the scenes?
In search of what this meant for our 230+ global customers (and their 550+ sites), my team loaded up on Mountain Dew and music and buckled down for the wild weekend ride—from Thanksgiving on through Cyber Monday. As mentioned in my last blog, my IT Operations team tracks a number of metrics like requests per second, response times, model builds, transfer rates and system loads during this time.
This year saw the implementation of product features and innovations that quickly multiplied our monitoring and measurement needs. To support this, we added in ThousandEyes, which provided deep visibility into all the global networks we touch and into our application delivery. We also built deeper measurements for things like cross-data center latency, global carrier monitoring, API connections, mean response times, records processed, SEO and…oh yeah, we still measure page views. For page views, we generate the now famous RichRelevance Devil’s Horns graph—where the left “horn” in the graph shows Thanksgiving/Black Friday views and the right one shows Cyber Monday.
As in years past, the numbers spoke loud and clear. In the past 6 days, we’ve delivered more than 19 BILLION recommendations (up from our previous record of 17 BILLION), over 533 MILLION page views on Black Friday (up from 400M last year) and managed more than 16,560 peak requests per SECOND on our servers.
Here’s a quick recap of our ride as we scaled the peaks of the Devil’s Horns in 2015.
November 25: T minus 1 to Thanksgiving
- In the two-day ramp up to Black Friday, we saw a 20+% increase in requests per second (from 8200 RPS last year to over 10,000 RPS this week).
- On Monday of Thanksgiving week, we saw over 300M page views, compared to 215M page views last year.
- Traffic doubled and ran higher and longer globally starting in early November. Typically, a normal day would show a defined growth to a peak, short idle, then a drop—think of a hill or small mountain’s shape. Whereas our troughs (nights) now rested around a sustained 4000 requests globally per second, a month ago they were below 2000. Seems like those earlier, longer holiday shopping periods sure are evident online.
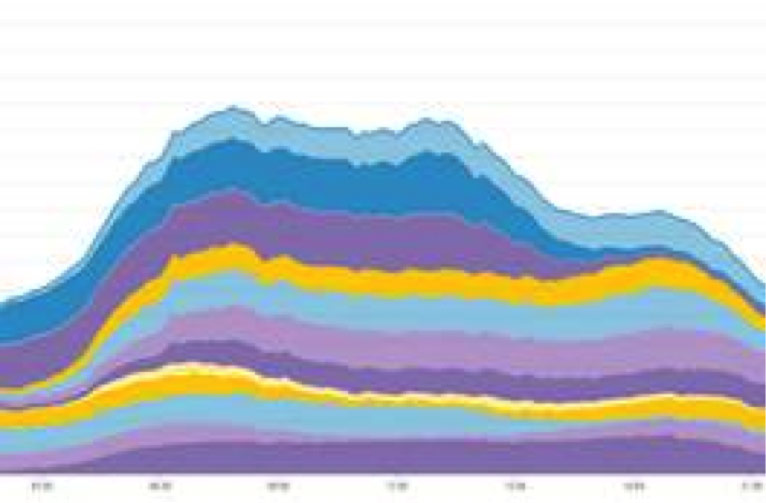
2015 looks like this (high at 9K)
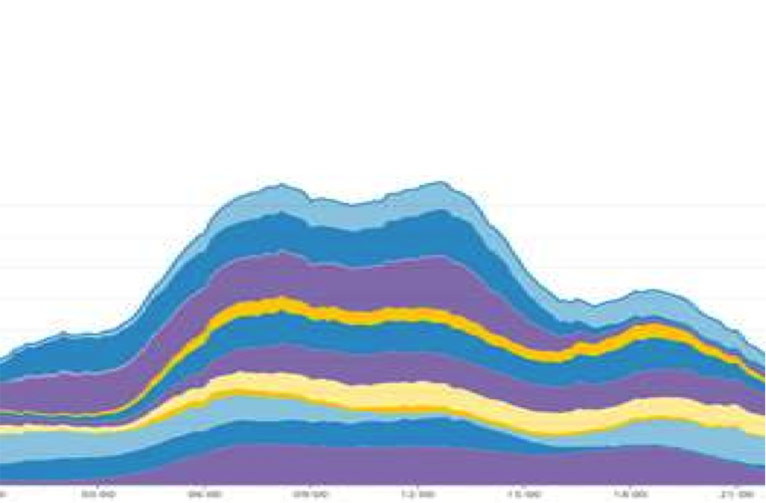
Instead of this (high at 4K in 2014)
November 26: Too stuffed with turkey to hit the “buy” button?
- In all the years my team has been tracking this, we typically we see higher page views on Thanksgiving compared with the rest of the weekend, but more purchases on Black Friday and Cyber Monday.
- Today, we hovered around 10,700 to 11,500 RPS all day and ran about 90,000 concurrent sessions worldwide. That RPS is much higher than last year’s plateau and represents a lot of shopping and browsing (which translates into a lot of page views).
- In fact, we beat our previous Thanksgiving page view record by nearly 26% (> 376M page views vs 300M in 2014).
- In spite of a major carrier issue with an Internet backbone provider in Europe (detailed below), I’m proud to say our centers were 100% up during their outage
November 27: Who says EU doesn’t have a Black Friday?
- At 6:44 AM on Black Friday, we hit over 15K RPS, growing to almost 16K RPS an hour later. This was led by our European data centers in Amsterdam, Frankfurt and Stockholm, with New York, Chicago and Virginia on the US east coast just below them. No question that it was a big online shopping day in Europe. Just look at the trough of the US night covering Thursday to Friday, it rests around 9000 requests per second all night, with Europe leading with about 3500 of that right into the middle of the US day. EU shoppers were banging their keys until after 11:00 PM GMT. Welcome to Black Friday, Europe!
- Page views for Black Friday were 33% higher than last year at 532M. Our former high was the previous Black Friday, with about 400M page views.
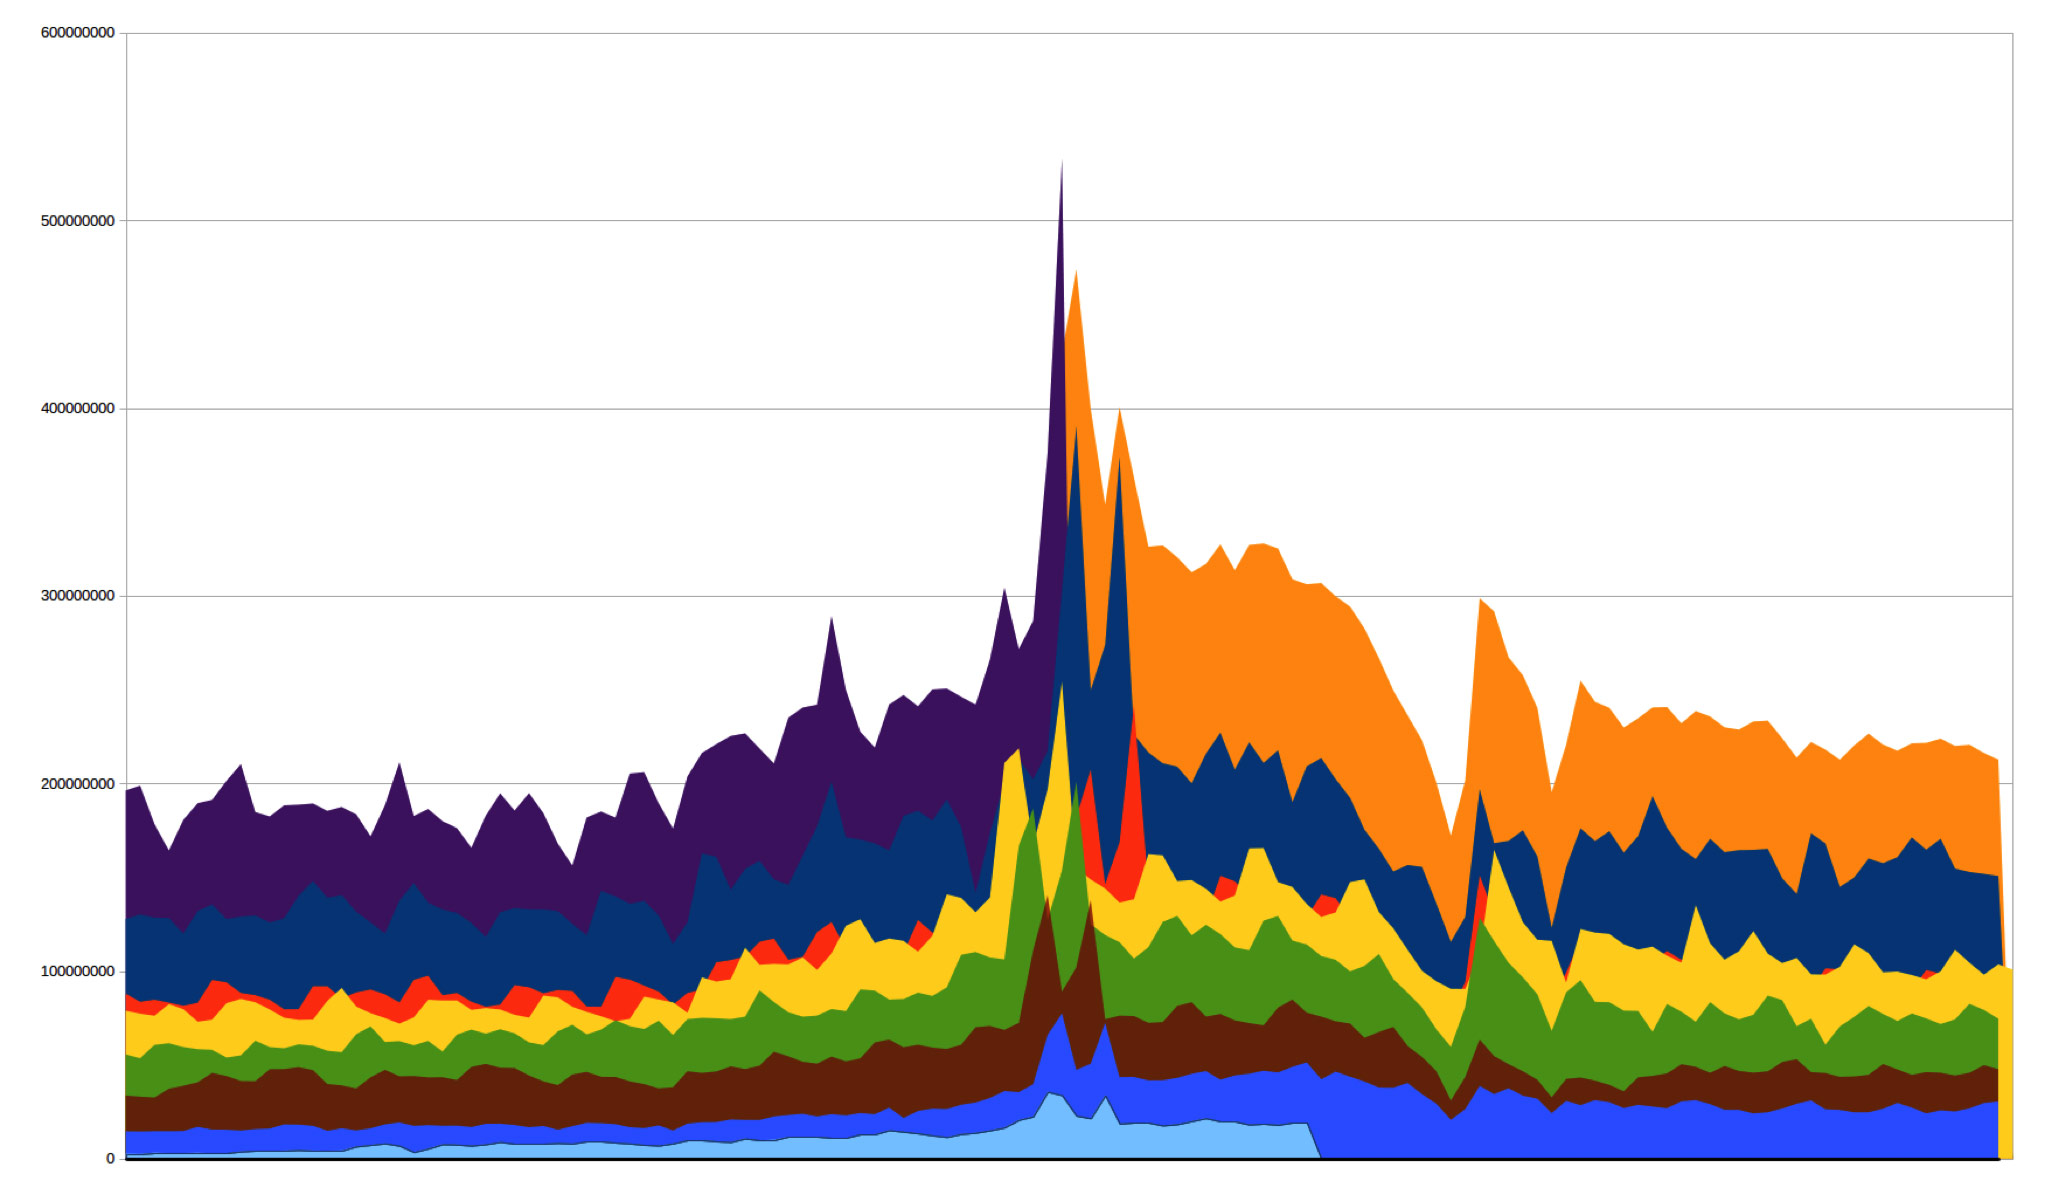
In the graph below, the purple shows current page views in millions up through Thanksgiving. Orange is the projections through the end of the year. Each color below represents the previous 7 years (2008 to current).
November 30: Cyber Monday
- The whole weekend was solid with midday plateaus at a healthy 10-12K RPS. No issues, a Steady Eddie kind of weekend.
- Page views peaked on Friday at 532M. Our high for Cyber Monday was 499M (498,573,302 to be exact).
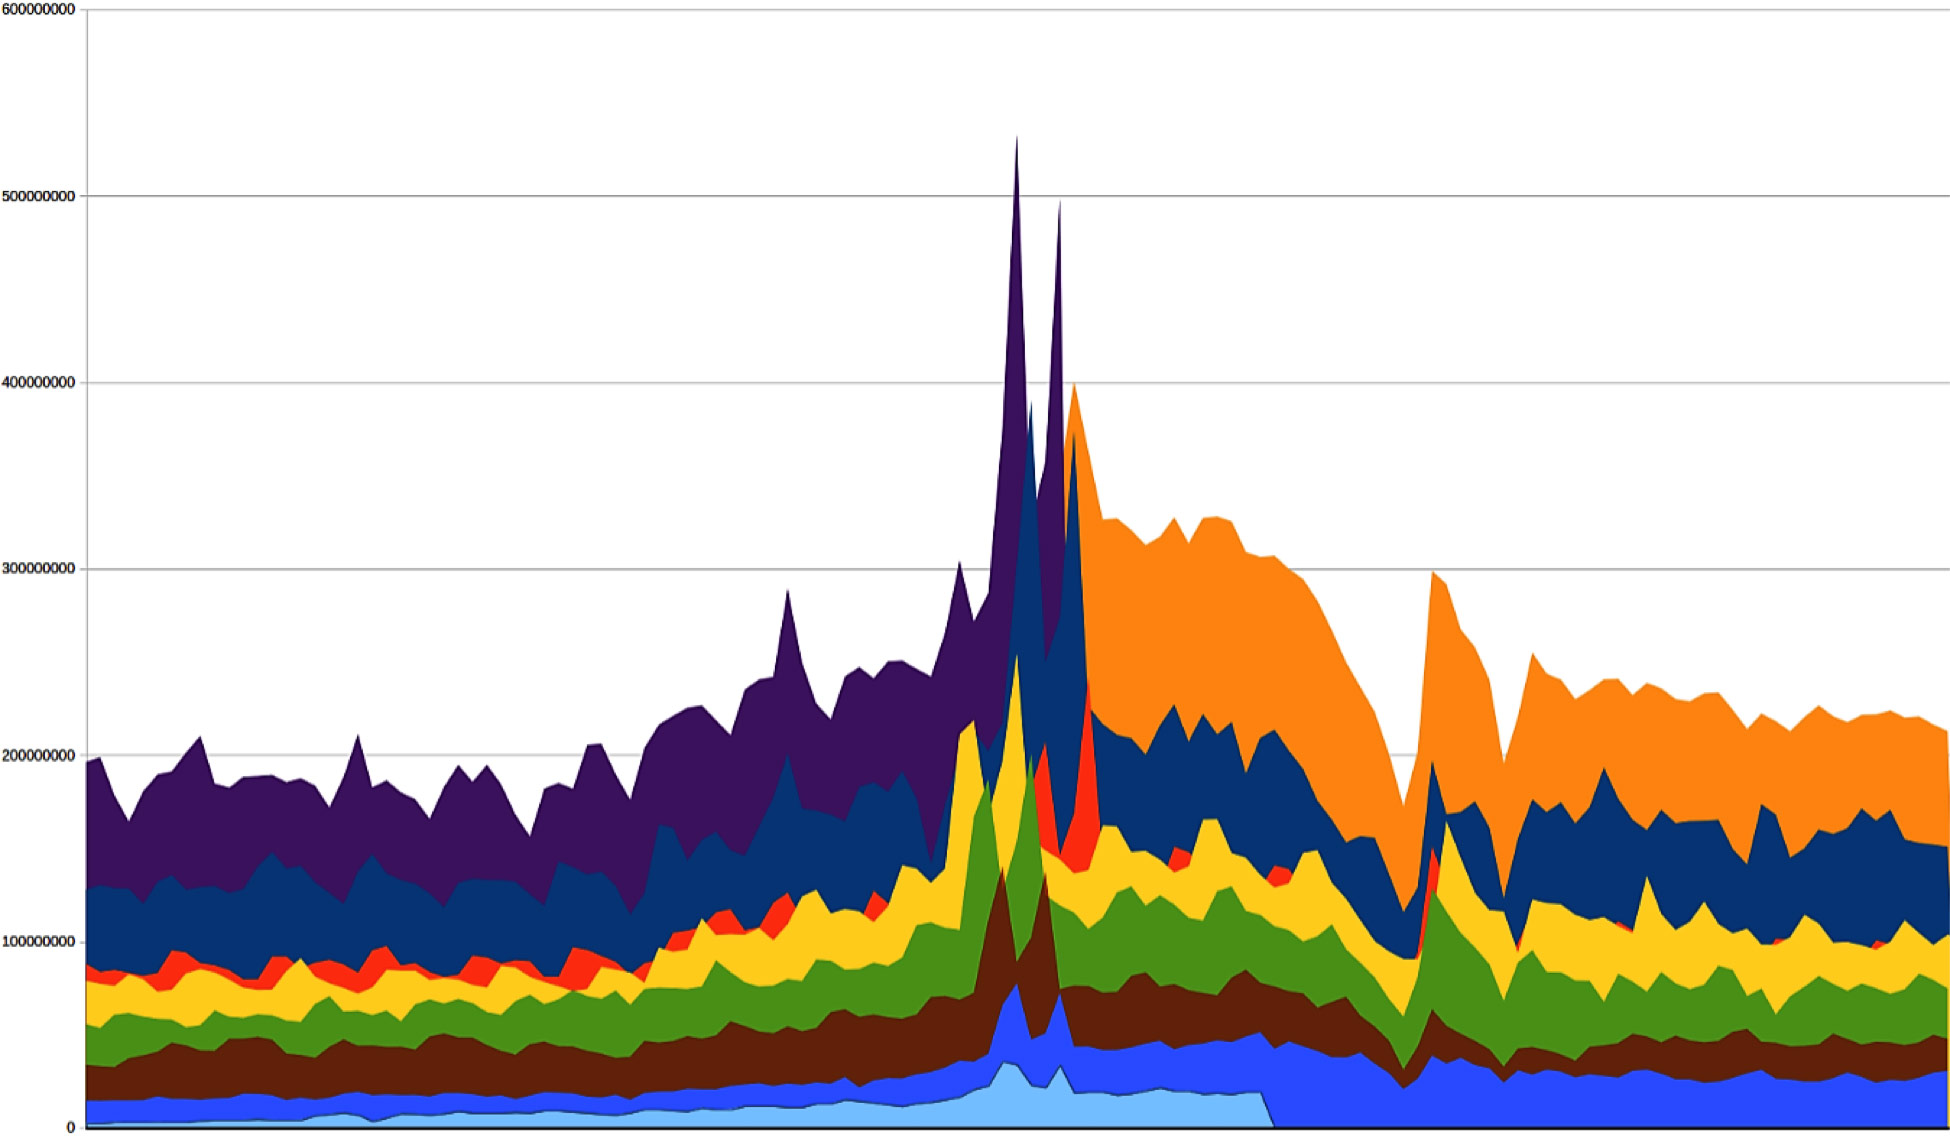
- We didn’t break our 17,120 RPS peak from last year, hitting just 16,530 RPS, but as noted above, we saw wider higher plateaus without the pointy peaks. This results in more views, more clicks, more recommendations and more value to our merchants. Note that many mobile apps don’t capture a “Page View,” so the large increase in mobile use would imply that the actual page view number is higher. Below is the Devil’s Horn’s for Cyber Monday. Look at how much higher the purple (this year) is to the navy (2014). We hit 499M page views vs 379M for Cyber Monday 2014. That’s more than double 2013’s 215M! It appears that the dynamic has flipped. For 5 years, Cyber Monday had higher page views. The last two years it has been Black Friday. That pretty much tells you that Black Friday is trending out of the malls and into your home and not by small numbers.
- Why was Cyber Monday lower? It all in the overnight numbers. That high Thursday night trough carried the numbers for the day, even with the higher plateau yesterday. The 4500 RPS difference overnight for 4-5 hours makes up the difference easily.
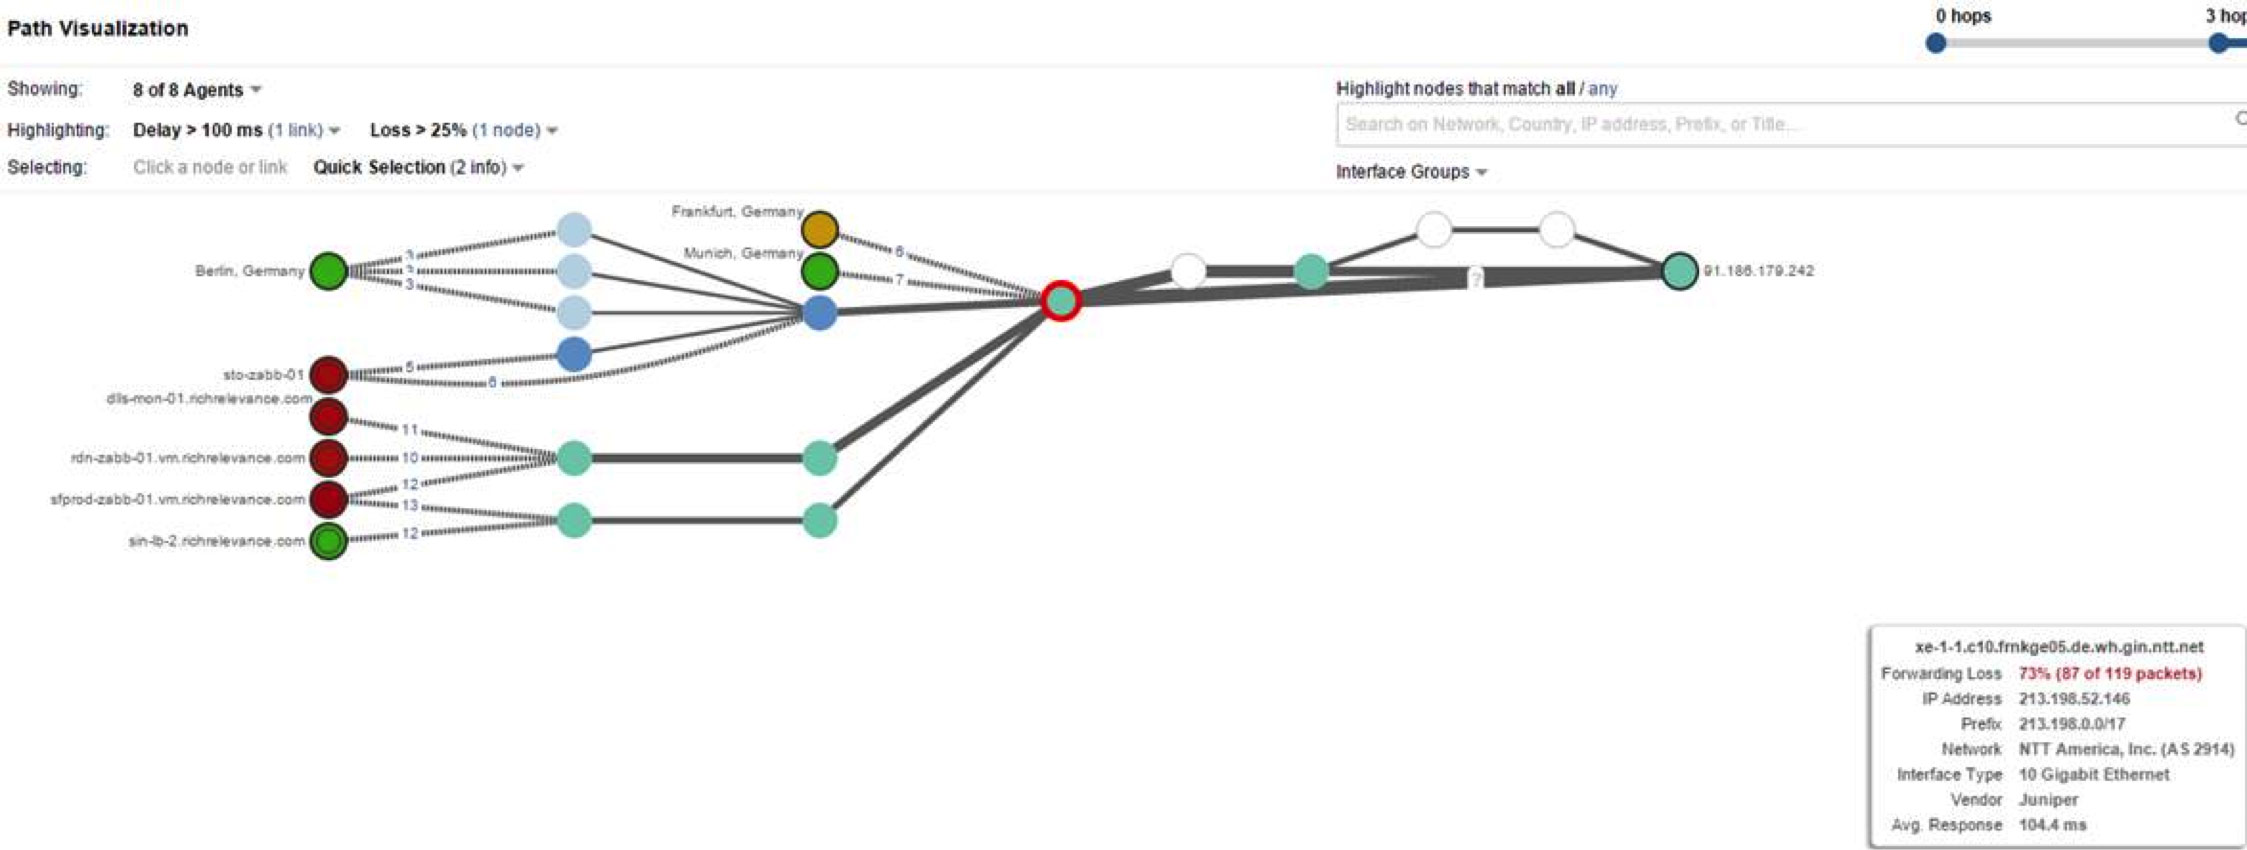
I mentioned above that we greatly expanded our monitoring and ability to see further into our solutions than ever before. Our newest toy, ThousandEyes, captured a regional anomaly on the European public Internet backbone before we even saw it affect our merchant’s traffic. The simple chart below is one of their traffic path visualizations. To the left is some of our global datacenters and the far right is our Frankfurt data center. The central red circle is the public Internet European hub that degraded for about 20 minutes due to high congestion and packet loss. In between, we can investigate and test every hop our traffic takes – sharing it in real time with our customers. This very cool, highly interactive chart provides a whole new layer of transparency to our service.
This new tool is just one example of how we constantly invest in new technology. As we move deeper into SOA this year, we will dive deeper and deeper into our services. Along with DataDog, this tool will be central to measuring our varied metrics.
So to summarize a great holiday shopping season opening weekend, in 6 days we had:
- 2.4B page views
- 3.5B recommendation placement views
- 19.5B recommendations served
At 100% uptime on all 11 of our front-end data centers.
As I mentioned last year I am blessed with a team that is like family to me. These highly skilled people worked tirelessly over our 6th Black Friday weekend together and remained as focused as our first time around. Just the right amount of caution, risk, nervousness and confidence ensured that we were up 100% again, for six years and counting. I am also excited for fantastic new product leadership at RichRelevance, bringing experience and even more thought leadership.
Some things just don’t change. Black Friday 2015 was a great shopping day as expected, but brought whole new twists to existing patterns. Longer periods of browsing, no longer sharp peaks, but long high flat periods with more interaction from EMEA. And now here we are at Cyber Monday +1 and we are already discussing our new scaling, expansion of Service Oriented Architecture, deep BI capabilities and of course more power <manly grunts>! Wash, rinse, repeat… here we go, 2016. We’re ready. Bring it.