RichRelevance research unveils consumer attitudes towards in-store technology are markedly similar across America, Britain and Europe, except when it comes to facial recognition.
A new report on omnichannel commerce shows that UK retailers are lagging behind their American counterparts in digital and in-store offerings, despite serving the world’s most mature ecommerce market. But even the US still hasn’t worked out the conundrum of linking up stock data.
The research, launched last week by digital think tank L2 and online personalisation company RichRelevance, puts UK high street stalwarts such as Tesco, Sainsbury’s, Selfridges and Marks & Spencer in the laggards’ camp, judged by the lack of ship-from-store services or visible cross-channel inventory.
De nombreux distributeurs n’accordent pas suffisamment d’importance à la stratégie de personnalisation, et bien souvent, estiment qu’il suffit d’un unique algorithme de recommandation. Voici quatre conseils clés pour une bonne personnalisation, qui montrent aussi que c’est un peu plus complexe…
It’s no secret that many households spend on the latest and greatest TVs when leading up to the Super Bowl. In fact, after I initially began working in retail a number of years back, I was surprised to find out that not only do people buy TVs specifically for Super Bowl parties, but some also go through the trouble of returning the TVs after their party (I know, exhausting)! Regardless of the enormity of your Super Bowl party, team affiliation (go 49ers!) and how many wings you’ll devour, there’s always some fun data to be explored.
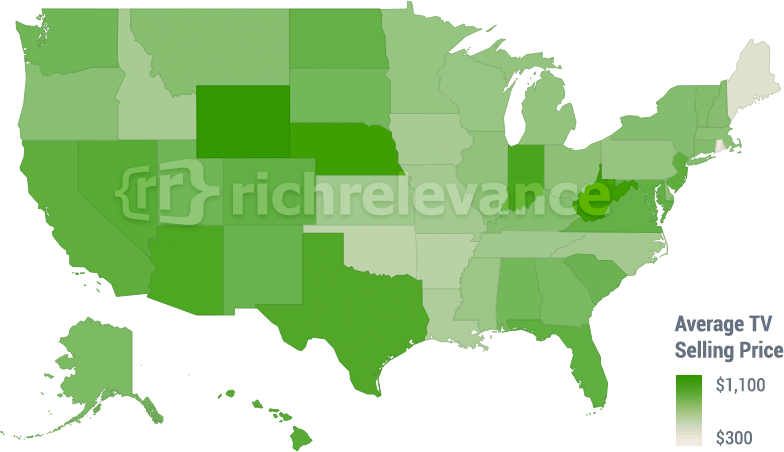
Through studying normalized data across our retail base (over 100+ sites in the U.S.), we found some interesting trends on TV purchases leading up to the big game. In the image below, you’ll see that there are some states that prefer to spend more on TVs than others. The darker green states spend more than the lighter green states. The average selling price of TVs ranged from $300 – $1,100, with Wyoming at the high end of that spectrum (mean price $1,119), and Rhode Island on the low end (mean price of $366). Wyoming winters are cold, so I don’t blame them!

It should come as no surprise that the most-searched TV brands were Samsung, Sony and Vizio. However, the most purchased brands were Vizio, Westinghouse, Magnavox and Element. It seems our consumers are still pretty cost-conscious, but are still buying for the big game, which leads to our next point below.
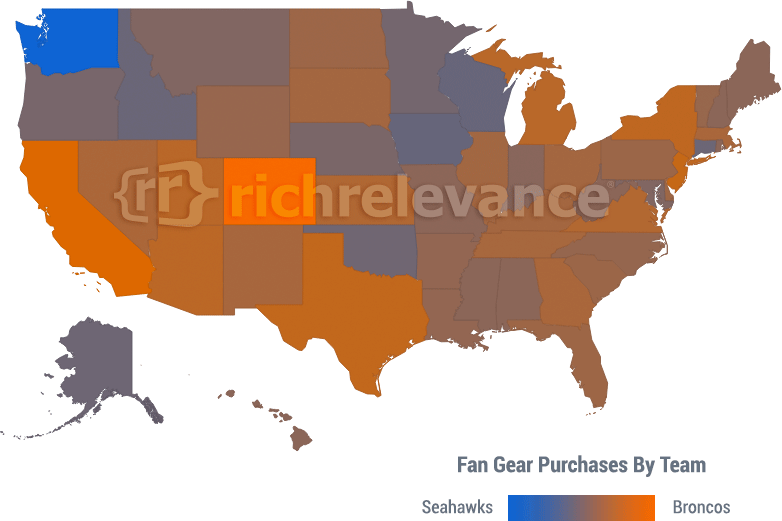
What do purchasing habits of Super Bowl team gear tell us about who consumers would like to win? We indexed team gear purchases by geo-location below (orange is Denver Broncos and blue is Seattle Seahawks). I’ll let the graph speak for itself, but I’m pretty sure fans are confident Peyton plans to throw some more “duck TDs” this weekend.


