We’ve finally slowed down enough to reflect on how we did in 2014 and the final holiday push: pretty darn great if I may say so myself. We ended another year at 100% uptime all year with record loads and HUGE growth.
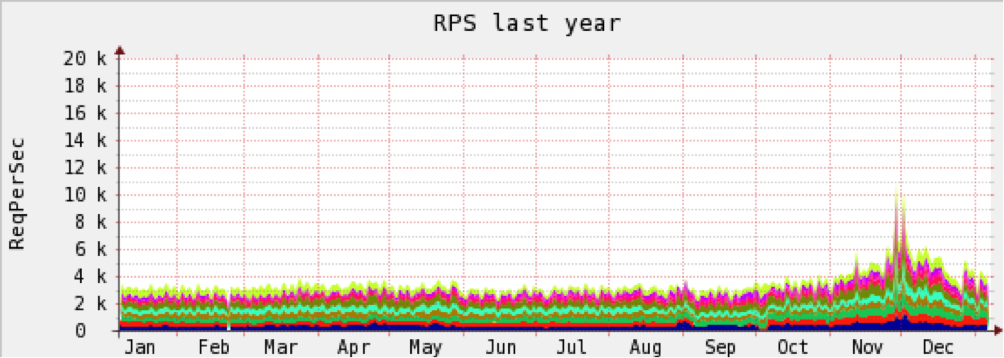
The graph below shows 2014 traffic, as measured in requests per second (RPS), highlighting the final Devil’s Horns through Jan 5. You can see Thanksgiving through Cyber Week and the dips in shopping on Christmas and New Years pretty clearly. Historically, the traffic we settle at by mid-January becomes the baseline for the next year. We typically gain online traffic each year from new customers but also see organic growth in the number of shoppers.
Each color below represents a different data center location.
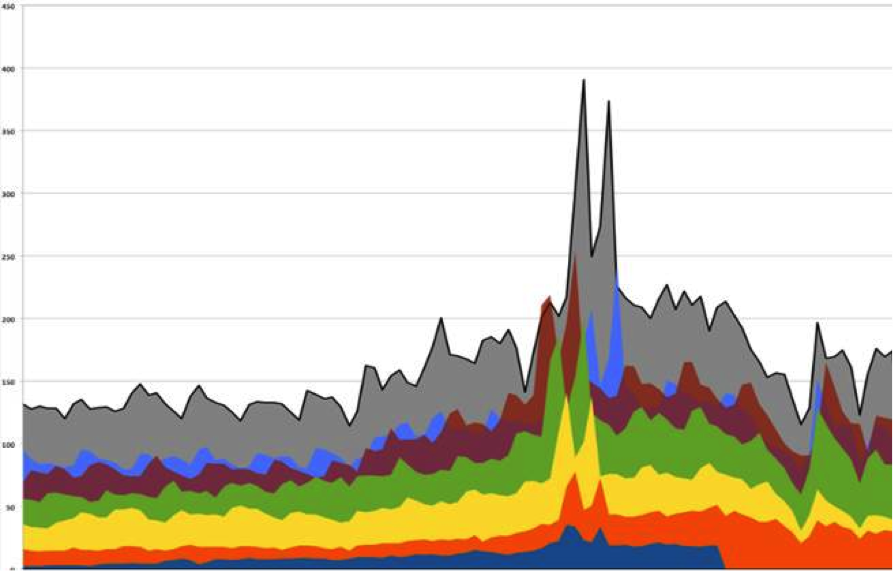
Below is a close up of the Devil’s Horns with page views on the left, and days across the bottom. The colors represent the years 2008 to present. We peaked a bit over 400M RPS (graphing smooths the numbers by averaging across time, making them look lower).
Finally, here are some fun stats for December 2014:
We served 10,297,583,013 impressions, converting over 51B recs at 100% uptime!
The month’s top search terms were:
- Laptops
- Sale
- Tablets
- Mens
- Clearance
- Mens clearance
- iPad
- Boots
- Frozen
- Lego
We kicked off 2015 with the launch of the Relevance Cloud and look forward to another year of continued innovation in personalized customer experiences with our customers! Here’s to great shopping and good health to us all.
________________________________________________________________________________________________
Original Blog Post from 12/03/2014
It’s been a mere 36 months since I wrote my last blog entry on Black Friday/Cyber Monday traffic. So what has changed? Nothing, and A LOT! We are still up 100% on our front-end services (52 months and counting). We still have the industry leading response rates and infrastructure platform.
But in the past 5 days, we served:
• More than 17 billion recommendations (up from our previous record of 8B)
• Over 400 million page views on Black Friday (up from 215M last year)
• More than 17,000 peak requests per second on our servers (vs 7,000 in 2011)
And oh yeah, our speeds never wavered from our blazing-fast, industry-busting, top-of-the-line service. We’ve also graduated from Mountain Dew to espresso, from Rush tapes to downloaded Urban tunes. We’ve gone from five data centers in the USA and two data centers in Europe to 12 data centers, directly supporting South America, Eastern Europe and Asia.
This year, we also invested in a great monitoring product, DataDog, as well as a fantastic scalable infrastructure. With DataDog we have the ability to track granular and custom metrics for that new infrastructure in a single place. Every year, I track the metrics of a number of IT operations that include requests per second, response times, model builds, transfer rates, load and page views (what I call the Devil’s Horns), for our 220+ global customers on over 500 sites for the most pivotal shopping weekend of the year. On my “Devil’s Horns” graph, the left “horn” shows Black Friday views and the right one shows Cyber Monday, with the dip further to the right being Christmas and Boxing Day spike following. In the graphs below, the gray shows current page views in millions, with each color below representing the previous 6 years (2008 to current).
Here are some highlights from our journey tracking the Devil’s Horns of 2014.
November 25: T-minus 2 days — Countdown to Thanksgiving.
Here’s how we looked as we started to map the Devil’s Horns graph last week.
- We surpassed 215M page views on Monday of Thanksgiving week; by this time in 2012 we were only in the108M range.
Gray is 2014 recorded traffic for the days leading up to Thanksgiving. Light blue is projected traffic estimated from past patterns and current sizes. Scale = Millions of Page Views.
- We hit nearly 10K RPS (requests per second—over two times what a typical shopping day sees), two days before Thanksgiving evening. By comparison, we peaked at 13K on Black Friday morning last year. So barely below with 48hrs of growth to come.
November 27: Is Christmas Creep eating into Thanksgiving?
- We beat our previous Thanksgiving record by nearly 40% (> 300M page views vs 255M in 2012).
- As of 7:40 AM PDT Thanksgiving morning, we were at 9.4K Requests per Second (RPS), which was already higher than 2013’s peak of 9K RPS.
- We ran the whole day at a plateau of around 10K RPS, with our peak being 11,800 at 4pm.
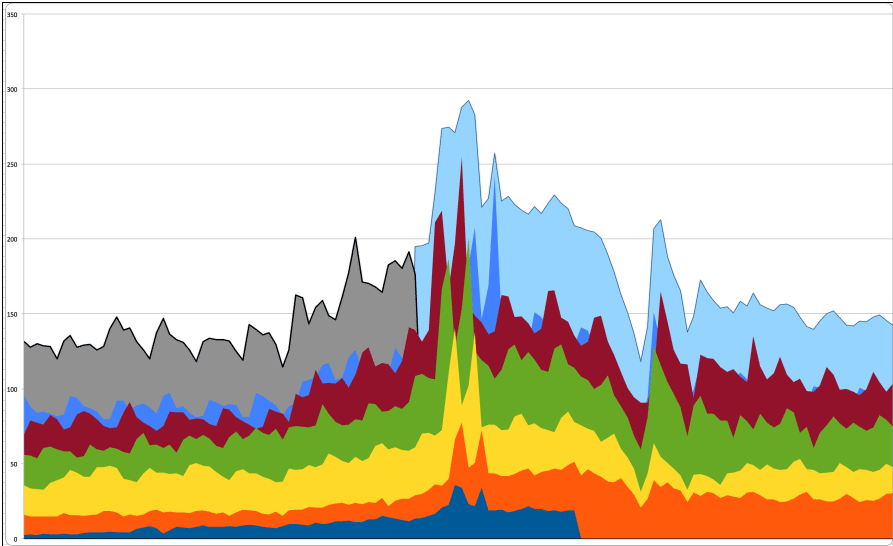
Gray is 2014 recorded traffic for the days leading up to and including Black Friday. Light blue is projected traffic estimated from past patterns and current sizes. Scale = Millions of Page Views.
It seems Thanksgiving has creeped its way to establish a solid Thanksgiving/Black Friday/Cyber Monday retail shopping trifecta! #ChristmasCreepIsReal. But we had another reason to give thanks today: no calls or merchant problems raised. That’s great news.
November 28. Black Friday continues to set records.
- Page views for Black Friday were over 400M. That’s not a typo, that’s Four. Hundred. Million. Our former high was the previous Cyber Monday with about 255M page views.
- Our steady states were really high at 7 – 9K per second with a plateau of 12K RPS, and we set a new record of 15,580 RPS at 8:20 AM PDT. The 7+K steady state overnight is double the HIGH mark of a regular shopping day; most normal overnight rates are about 1.5 – 2K and daily highs are 3.5 – 4.5K.
- We had a weird spike at 1 AM PDT on Black Friday: 7,500 RPS mostly coming out of EMEA (The dark blue and purple shaded area represent Amsterdam and Frankfurt data center traffic in the below charts). This corresponds with morning/midday hours in that region. This year the EU entered the USA Black Friday craze setting records both in store and especially online. In the UK, where Black Friday was fully adopted by an ever-increasing number of UK retailers, several websites crashed on Black Friday amidst shopping frenzy and near riots. Not us! Welcome to Black Friday, UK.
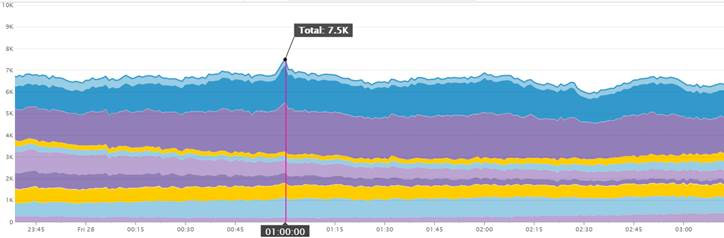
A mystery midnight mini peak.
Above is the overnight RPS graph zoomed in to show that weird sudden peak. I’m hoping the {rr} team in the EU was buying my team some treats.
Let’s also take a quick look below at the same RPS Graph worldwide for that 48 hours, from Thursday through Friday, to see that overnight traffic. That’s a lot of sleepy shoppers.
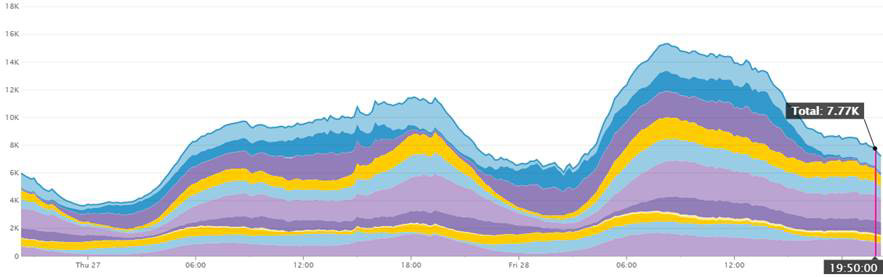
48-hour view of Thanksgiving and Black Friday.
December 1: Cyber Monday
- The whole weekend was solid with midday plateaus at a healthy 10K RPS. No issues, Happy merchants and shoppers.
- We saw page views peaked Friday at 400M. Our high for Cyber Monday was about 374M. A bit lower.
- We hit our all-time high today of 17,120 RPS at 12:00 Pacific time, compared to the previous record 13,300 RPS on Cyber Monday 2012 — about a 22% growth, 2012 vs 2014. This is up 15% from the 15,580 RPS this last Friday—So while more RPS at peak, the higher “low water” mark of Black Friday morning and night allowed it to surpass Cyber Monday for total page views. Note that many mobile apps don’t capture as a “Page View,” so the large increase in mobile use implies that the true page view number is higher for both days.
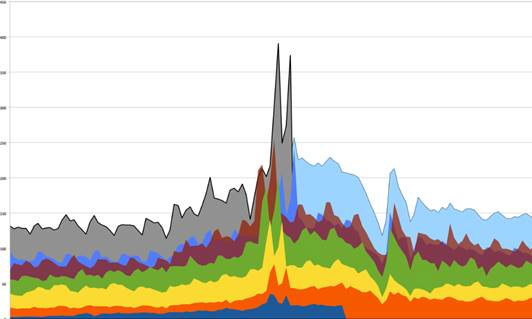
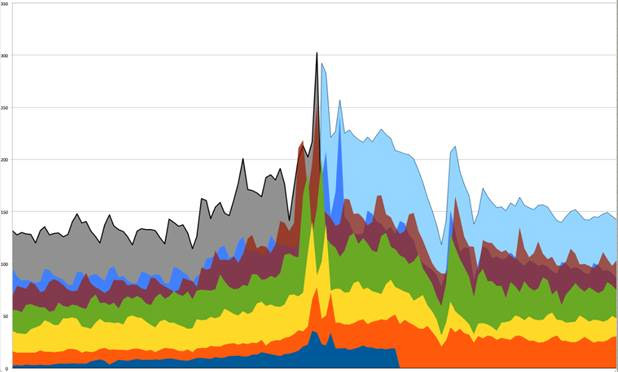
Gray is 2014 recorded traffic for the days leading up to and including Cyber Monday. Light blue is projected traffic estimated from past patterns and current sizes. Scale = Millions of Page Views.
I mentioned above that we greatly expanded our monitoring and our ability to see further into our solutions than ever before. DataDog, our new monitoring tool is very granular—down to the millisecond when we need it to be—and it provides our developers the ability to build custom monitoring into their code. In fact, in 2015, you’ll want to keep a lookout for a public-facing status page on our metrics.
I do get a bit reflective this time of year. I’m thankful to be blessed with one of the best Operations team in my career; the core group has been with me through five of these past holidays (I did say 52 months and running at 100% uptime, right?). I’m thankful to have the best engineers, architecture and infrastructure in the industry and the phenomenal vision of our Product Team and CEO; and of course, thankful to have the best retail merchants as my customers
As I said in the beginning, some things just don’t change. As we wind down the trifecta of online shopping events, I’m already excited for 2015 — build, scale-up, new pricing models, merchandise, engage, more customers and of course more power <manly grunts>! Wash, rinse, repeat… here we go, 2015. We’re ready. Bring it.
Eleven data centers enable the company to maintain uptime and performance at global scale, while increasing speed to delivery, for the world’s largest retailers
San Francisco, CA – Nov. 14, 2013 –– RichRelevance®, the global leader in omni-channel personalization, today announced the expansion of its data footprint with two new data centers—bringing its total to 11—in Singapore and Stockholm, Sweden. The new state-of-the art, certified facilities allow the company to continue delivering personalization decisions at 100% uptime to its clients in the Asia Pacific and Eastern Europe regions, and also worldwide.
“Expanding our global data footprint allows RichRelevance to efficiently manage massive amounts of shopping data, providing seamless service to our partner retailers and their customers,” said Kevin Duffey, RichRelevance Vice President of IT Operations. “Distributing our data centers in key locations worldwide helps ensure RichRelevance’s unmatched performance and reliability, while providing maximum uptime and minimal latency.”
RichRelevance drives more than one billion decisions every day, and has delivered over $8 billion in attributable sales to its clients, which include Target, Sears, Marks & Spencer and Priceminister. The company recently opened a data center in Miami, FL to provide delivery service to South America. Its 11 data centers worldwide enable it to collect and manage a massive amount of real-time data, including anonymous user behavior, catalog data, inventory status, and trends combined with historical user and product information.
This infrastructure relies on a cloud-computing model leveraging load-balanced servers that use solid state drives, in order to deliver the highest possible throughput with the lowest latency for the company’s retail partners. During the peak of 2012 holiday traffic, RichRelevance operated at less than one-sixth of capacity despite serving 8 billion product recommendations at a rate of up to 11,500 responses per second. In fact, every five minutes, the infrastructure processes nearly 80,000 shopping sessions, more than 330,000 retail page views, more than 17,500 recommendation clicks, and 385 orders with a recommended product.
“Google and Amazon have measured that every one-tenth of a second (100 ms) delay in latency equates to 1% decline in sales, so equipping our customers and partners with an infrastructure that enhances performance is a cornerstone of our value,” said Eduardo Sanchez, President of RichRelevance. “The global breadth of retail necessitates speed, reliability and scale, and we’ve built an amazing framework to not only meet our clients’ current needs, but helps equip them for the future as well.”
For more information on the company’s infrastructure and offerings, please visit: https://richrelevance.com/solutions/technology/.
About RichRelevance
RichRelevance is the global leader in personalization for the world’s largest retailers and brands. More than 160 international companies use RichRelevance to turn data into actionable insight, which delivers the most relevant experience for consumers as they shop across web, store and mobile. RichRelevance drives more than one billion decisions every day, and has delivered over $10 billion in attributable sales to its clients, which include Target, Marks & Spencer and Priceminister. RichRelevance is headquartered in San Francisco and serves clients in 40 countries from 10 offices around the globe. For more information, please visit www.richrelevance.com.
We continue to think about our customers, friends and families on the east coast as they fight through yet another storm. We’re built to serve you and are here to help in any way you need. You can also make a donation to the Red Cross here.
 At RichRelevance, we built our infrastructure to be a fully redundant self-healing service—one that could withstand the toughest conditions and worst disasters. Very rarely does one encounter such tests, but Hurricane Sandy provided just such a catastrophic outage to prove our systems.
So what happened during Hurricane Sandy? In short, our New York data center went from 100% online to catastrophic flooding in 90 minutes; but in spite of this, our operations and delivery to our customers never skipped a beat. Here’s the rundown of events:
Ecommerce on an Olympic level: Darren Hitchcock, VP of EU/UK at RichRelevance, shares three important tips.
 There has been a lot of discussion—since 2008, in fact—about the consequences of intensified demand on London’s data centres during the Olympics. As a retailer, you may have taken note of the warnings and put a plan in place long ago to ensure your infrastructure’s uptime and reliability. You’re sorted. Right?
Maybe not. If you haven’t considered how your third-party application providers could impact your website during the Olympics you could be putting your business at risk. Recommendations, reviews, video, gamefication—any time you’re adding technology to your site through a partner, you need to consider what precautions they’re taking to ensure their own data centre solutions are reliable. If one of your features goes down it could disappear from your site or, worse, cause your site to slow down significantly.
It’s too late to make serious changes before the Games, but the Olympic challenge retailers are about to face does shine a much needed spotlight on this issue. So what can to ensure your website is as good as gold?
 With the Olympics just around the corner, it’s not just athletes that are undergoing intense preparations in anticipation of record-breaking performance, but also many technology and infrastructure providers. Just in the past two months, outages from Amazon Web Services prompted outcries from many startups (including Netflix, Pinterest, Instagram, Quora) and their customers. It’s no wonder that infrastructure uptime and reliability are top of mind these days.
The intensified demand and consequent risk for London’s data centres during the Olympics was identified as early on as 2008, with some companies even suggesting that the official energy supplier to the 2012 Games would have to limit the energy it supplied to other organisations in central London in order to guarantee supplies to the Olympic Park and other venue. One such company, Interxion, is actually going so far as to install sleeping pods at its London data centre campus, so that on-call engineers can be on site 24-7 to ensure uptime for its customers.
Jan 2011 after the 2010 holiday season….
Still in the glow of 100% uptime, response rates around 80ms, 5.5K requests per second served at peak.
We’re all sitting around in IT Ops excited, pumped and ecstatic for our performance. We’re beating our chests and basking in the glow of success. 5500 Requests per Second (RPS) peak—our measurement of capacity reached and slayed. Hey guys, I have the year-over-year page-view graphs. Look at that, over 147M page views in one day—wow.
 Then someone chimes in, “but, guys, we are bringing on more than five of the top 20 retailers this year, and we’ll double that traffic. In Europe we will easily double what we did in 2010. What if online shopping takes off even more, and we TRIPLE that?”